I recently had the privilege of attending and presenting at the 2022 OpenInfra Summit in Berlin 1 and wanted to provide a synthesis of some of the ideas I presented. Namely that hyper-converged infrastructure is a hard problem, requiring deep performance analysis and tuning across the kernel for things to just “play nice”. Checkout my presentation 2 for the full treatment of the topic. Here I’ll summarise some of issues covered in the talk and how I came work on them.
## Some Background
I’m a Software Engineer for Canonical within the Sustaining Engineering team. Sustaining Engineering provides L3 break/fix support to Canonical’s customers and because of this we maintain a team with broad and deep expertise though all of the software we support from OpenStack to server applications like MySQL and the Kernel. Canonical supports numerous (think thousands) OpenStack clouds at scale with Ubuntu being the foremost distribution underpinning OpenStack deployments 3. Because of the team’s unique “catch all” position, it frequently affords us the opportunity to deep-dive into interesting problems and topics.
## The thesis
The thesis of my argument in this talk is that, managing the breadth of applications required for a cloud and their resources is a complicated matter at the best of times, but is particularly difficult in hyper-converged architectures. Applications competing for resources can create a compounding effect on resource starvation, or alternatively, due to vast interplay of applications and configurations, despite available resources, you encounter edge cases where things simply don’t work.
But what are these cloud architectures I’m talking about? For those well versed in the technical aspects (or marketing prose) of on-premise cloud infrastructure, these may already be well known, but I’ll highlight here some basic definitions for discussion.
## Disaggregated

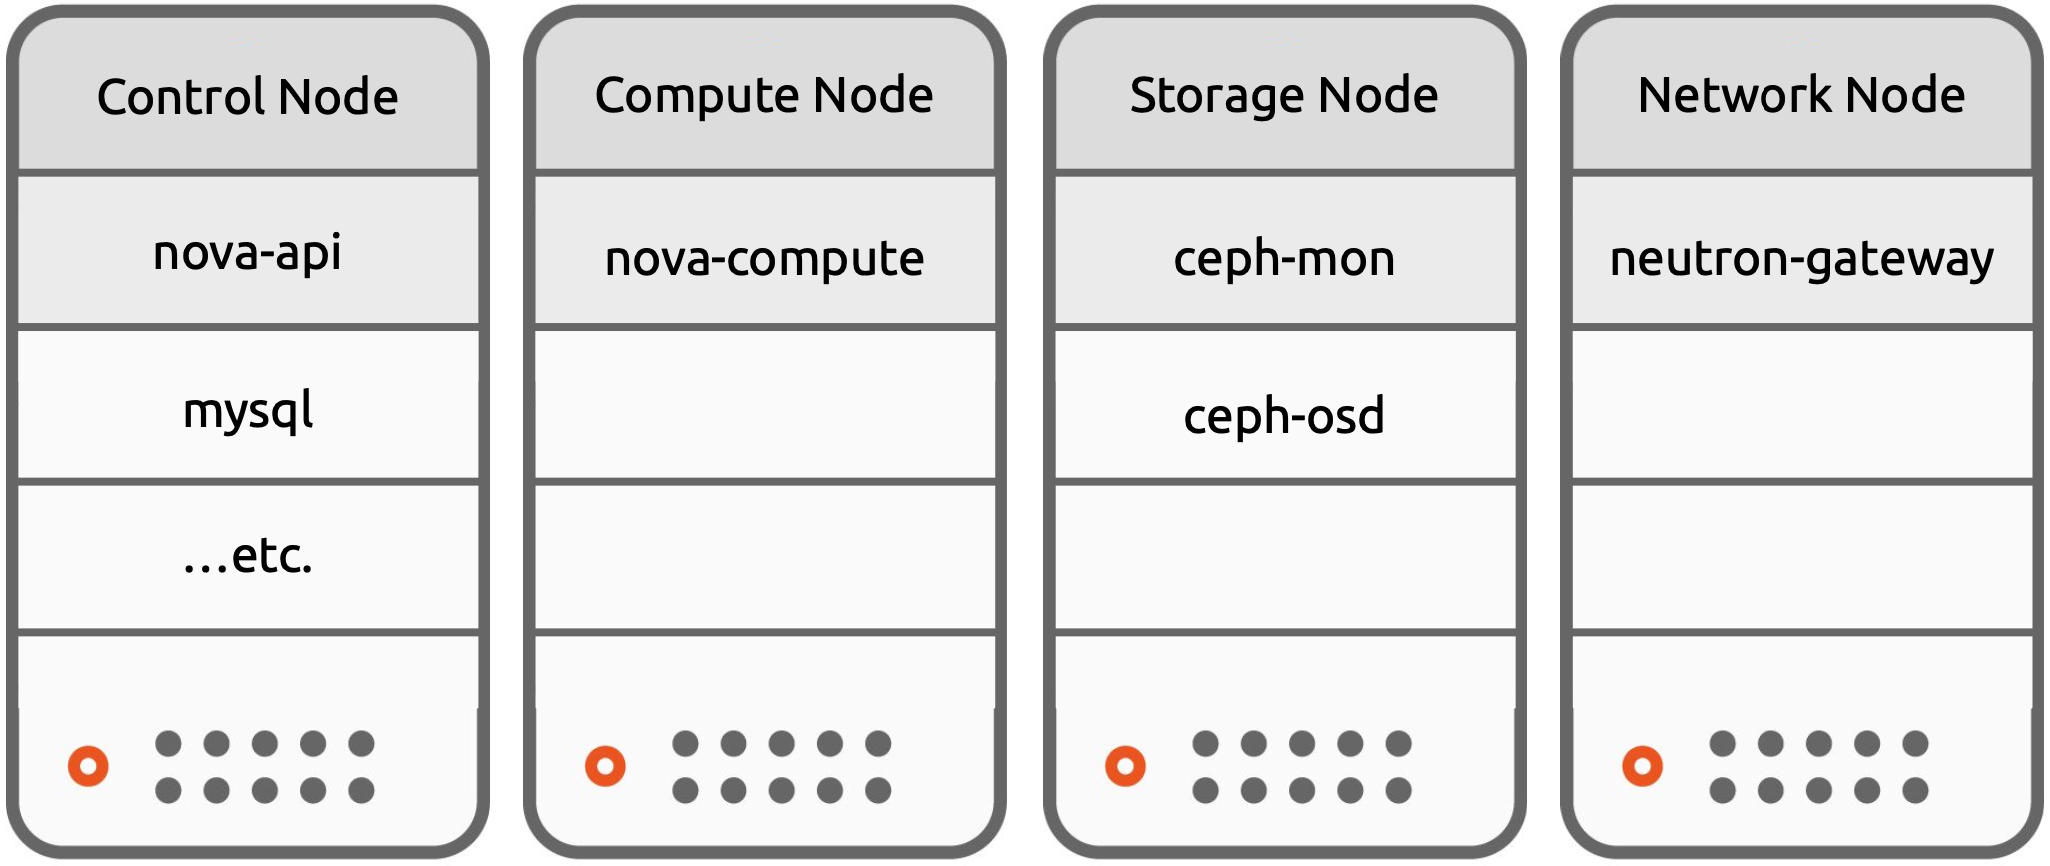
Disaggregated Architecture
Disaggregated architecture is where Compute, Network, Storage and Control Plane components are all hosted on separate nodes. It allows logical separation of applications by workload and hardware requirements, as well as, separation of User and System workloads. It also cleanly accommodates mixing hardware and software components, for instance a dedicated network or storage appliance.
## Converged

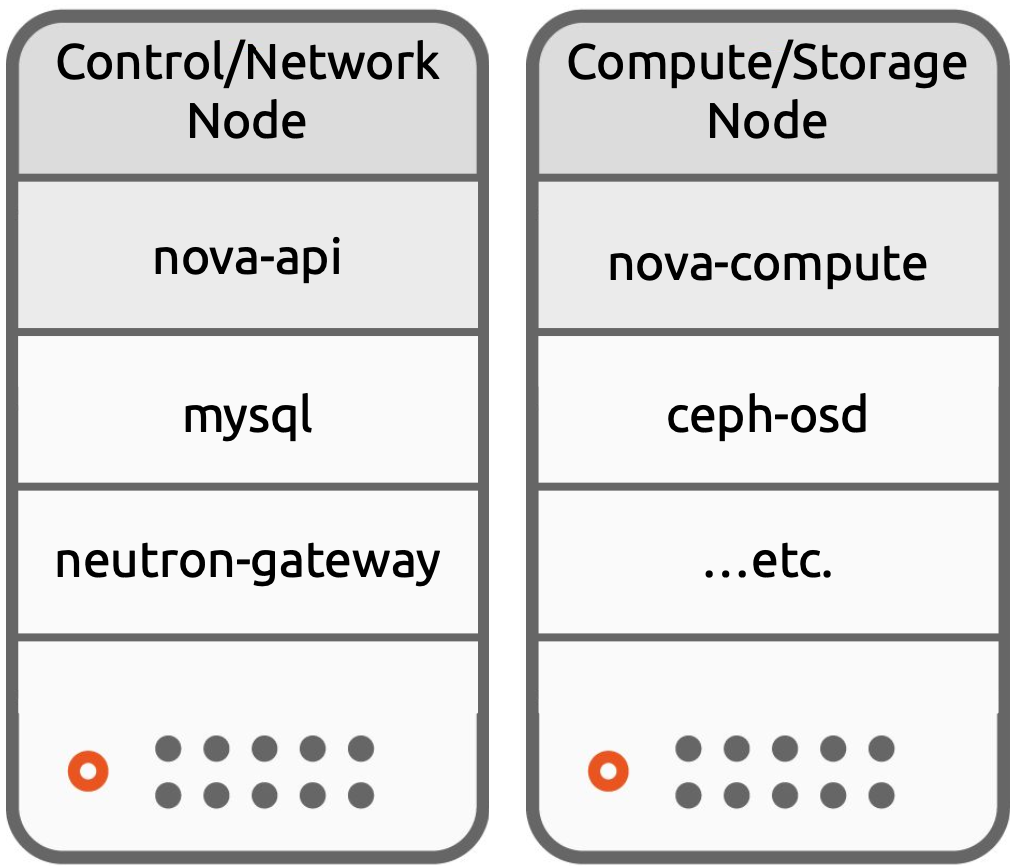
Converged Architecture
Converged Architecture is where one type of node hosts the network and control plane components, while another type of node hosts the storage and compute workloads. It still permits the separation of of System and User workloads, but combines some of our functions and requirements from the previous architecture.
## Hyper-converged

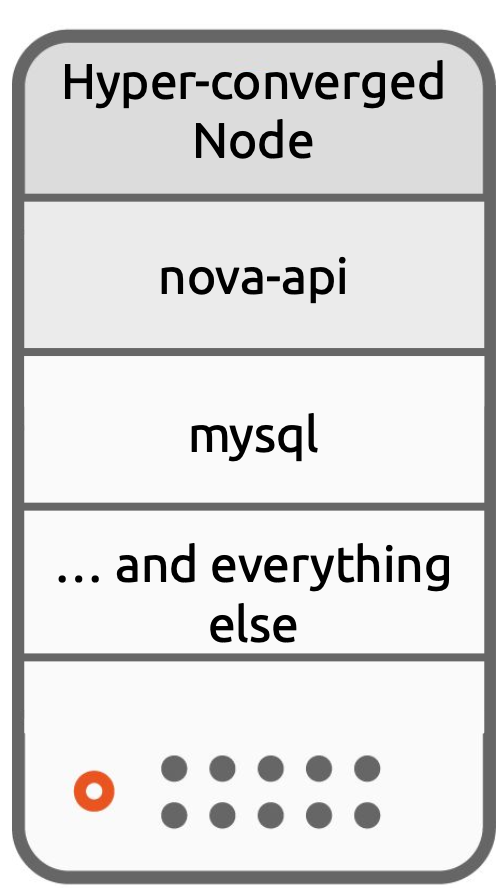
Hyper-Converged Architecture
In Hyper-Converged architecture all functions; Compute, Network, Storage and Control Plan are distributed across all nodes of the cloud. These applications might be logically separated with containerisation, in the case of Charmed OpenStack, by use of LXD containers. This is typically a sought after choice for general purpose workloads, in order to maximise utilisation and flexibility. These three architectures serve largely as a talking point for design and implementation processes, however in reality a combination of hardware and software components and converged and disaggregated nodes are common and In the near future a fourth architecture will likely emerge as we see the proliferation of DPUs and SmartNics.
## Analysing Hyper-converged infrastructure
Analysing and working with hyper-converged infrastructure presents a unique challenge, because of the need to be aware of many software components simultaneously. Some key facts to gather when working with hyper-converged infrastructure are:
- The Per-host application layout including:
- Kernel
- The OS as well as
- Key system applications that are hosted.
Its worth noting, there might be a number of combinations in a hyper-converged setup i.e.
- nova-compute, ceph-mon, mysql on one node
- nova-compute, ceph-osd, rabbitmq on another
Its useful to be aware of this, and in some instances to generate a service map. This map can be helpful in narrowing down issues, ruling out specific services or layers, or focusing in on the interaction between two particular applications. For instance if an issue is reproducible across a range of hosts with different service maps, this may rule out interactions between certain application, and allow you to target more specific combinations.
Some key considerations when working with hyper-converged infrastructure:
- You may need to make ‘common denominator’ configuration choices across your cluster unless you’re set up to manage the complexity of a heterogeneous cluster.
- You should separate user workload concerns from system workload
concerns when modelling requirements.
- Start by analysing the control plane, network and storage requirements first before adding in user workload concerns
- You should also check how an application and its requirements scale.
- Including, does it scale with user workload?
- How does it scale and whats the relationship?
What follows is a set of case studies from my work that exemplify the “cross-stack” purview and analysis typical of work of me and my colleagues and that elucidate the methodology problem solving techniques presented.
## Case studies
## 1. Ceph Filestore
In this case the issue presented as:
- Intermittent kernel panics
dmesglogs with with kernel hung tasks ala."INFO: task ... blocked for more than 120 seconds"
The Software stack they were using:
- Ubuntu 14.04.5 LTS
- 4.4.0-201-generic #233~14.04.1-Ubuntu
- Ceph (Jewel) 10.2.10-1trusty (ceph-mon and ceph-osd)
The output of free looked like this:
             total       used       free     shared    buffers     cached
Mem:     396157596  393359960    2797636       5956      16752  156053980
-/+ buffers/cache:  237289228  158868368
Swap:            0          0          0
There was sufficient free memory, with the excess being used for cache.
So what is the application behaviour Ceph Filestore? OSDs are implemented on top of a common file system (in this case xfs). The OSDs make use the page cache to buffer reads and writes and dirty pages (writes) are frequently flushed to disk. Clean pages (reads) fill the page cache quickly and might linger if never invalidated.
This is demonstrated in the output of /proc/meminfo:
cat proc/meminfo | grep 'Active\|Inactive\|MemTotal'
MemTotal:       396157596 kB
Active:         294196400 kB
Inactive:       78560912 kB
Active(anon):   216689236 kB
Inactive(anon):     4360 kB
Active(file):   77507164 kB
Inactive(file): 78556552 kB
So whats the problem here? Reclaim needs to take place to use that
memory, some times direct reclaim need to happen at inconvenient times
to satisfy memory allocation requests. We can’t directly set a point at
which kswapd wakes and performs asynchronous reclaim but we can see when
it will by looking at /proc/zoneinfo.
grep 'Node.*Normal' /proc/zoneinfo -A 4
Node 0, zone   Normal
  pages free     471965
        min      11150
        low      13937
        high     16725
--
Node 1, zone   Normal
  pages free     33683
        min      11269
        low      14086
        high     16903
- high: when free pages drop below the high watermark asynchronous reclaim takes place until at least high number of pages are free
- low: when values drop below low and an allocation is requested, direct reclaim takes place and the allocation is stalled until enough memory is freed to satisfy the allocation
- min: watermark min = minfreekbytes: free pages don’t go below this
So what can we do about this? On Linux 4.4 not a lot, however these values are set as a multiple of minfreekbytes, so we could raise this value to push the kswapd to reclaim earlier. A second option is manually drop caches and compact memory.
# run the following daily
echo 1 > /proc/sys/vm/drop_caches
echo 1 > /proc/sys/vm/compact_memory
## 2. Swift on XFS
In this case the issue presented as reads and writes to a Swift (OpenStack Object store) cluster failing at a high rate with 503 Service Unavailable. This was not a complete outage, but significant enough degradation of service cause concern. Additionally object storage often underpins other essential services of a cloud, leading to knock effects for other aspects of the cloud (like launching VMs for instance).
Their Software Stack was:
- Ubuntu 14.04
- 4.4.0-148-generic
- XFS
- Swift Mitaka
The symptoms of this issue are highly generic (503s don’t tell us a lot) so detailed knowledge of the service architecture was required to begin diagnosing the issue. Investigating this issue, the object replicator service was producing a high number of quarantined files and in turn produced large (thousands of multiple gigabyte sqlite) container databases. Replication of these container databases were failing in a number of ways:
- Including
LockTimeout (25s)when trying to replicate databases. - Various
DatabaseErrorleading to quarantined databases files. - XFS metadata I/O errors and
corruption of in-memory data detectederrors were also observed.
How does Swift replication take place? When replication takes place, under the hood swift will sync batches of rows when the differences between databases are small and rsync the entire container db when the differences are large. These databases were large (~25G), and unable to fully replicate across the network under these conditions in a acceptable time frame.
Additional analysis noted a high level of memory fragmentation, as demonstrated by a lack of higher order pages. Analysing memory usage further there was:
- Around 11.8G of anonymous memory usage
- 32.3G of file memory usage
- Total reclaimable memory usage was about 52.9G
Reclaim certainly should have been possible, but it was clear it wasn’t happening soon enough. Analysing /proc/slabinfo the major contributors to usage were
- xfsinode ~39G
- dentry ~4G
This indicated two paths forward.
- increase vfscachepressure to preference dropping dentry/inodes when reclaim takes place, and
- to force reclaim of that memory
# prefer dropping dentry/inodes
echo 200 | sudo tee /proc/sys/vm/vfs_cache_pressure
# force drop dentry/inodes
echo 2 | sudo tee /proc/sys/vm/drop_caches
echo 1 | sudo tee /proc/sys/vm/compact_memory
Further investigation led to the identification of the root cause
45 where Swift was unintentionally triggering an XFS anti-pattern
where by pending objects were written to a temporary file under tmp
directory then were renamed to move the object into the file hierarchy.
This leads to a disproportionate number of inodes in a single XFS
allocation group, resulting in poor performance. This is fixed in latter
versions of Swift with appropriate use of OTMPFILE, however
in the current environment this was unavailable. These kernel
adjustments were able to restore service to the environment in the
meantime.
## 3. Hyper-converged Architecture with HugePages
The third case study presents a recurring issue with HugePages on a
hyper-converged architecture. When creating OpenStack instances backed
by HugePages they frequently failed even though /proc/meminfo reported
ample free HugePages.
Software stack:
- 4.15.0-72-generic #81-Ubuntu
- The issue was reproducible across the cluster which implied it was not specific to the service maps of one particular node.
The initial investigation showed the instances were failing to start with this allocation error:
Oct 22 19:49:33 compute6 kernel: [24965727.652627] qemu-system-x86: page allocation failure: order:6, mode:0x140c0c0(GFP_KERNEL|__GFP_COMP|__GFP_ZERO), nodemask=(null)
### Application Behaviour: QEMU
When QEMU starts a VM process it can pre-allocate memory for the instance, but it also needs to allocate some memory for executive functions. The system has ample HugePages, and thus on monitoring it appears to have significant free memory, but in this instance there is an acute shortage of higher order pages for QEMU to claim. In the hyper-converged architecture we allocate a portion of memory that is reserved for system use. This needs to account for various applications with various usage patterns including this allocation which comes from the system portion but is required by and scales with the user workload.
Our initial solution had two paths
- Increase the reserved portion of memory, which in this circumstance this was a difficult as 20G of memory was already in reserved.
- Reduce the utilisation of the reserved portion of memory
Drilling down with the usual tools including ps, it was noted that no particular process was utilising that much memory.
- The largest consumer of memory at the time being OVS, which was less than 1G of memory.
- There was however a large number of nova-api-metadata processes, 161 to be precise, and together they accounted for roughly 14G of memory.
### Application Behaviour: nova-api-metadata
The Metadata service provides a way for instances to retrieve instance-specific data by responding to requests on 169.254.169.254 with the Openstack or EC2.
nova-api-metadataapplication serves the Metadata API and routes its requests.- It is needed anytime you need metadata with a common one being on instance boot.
In a highly dynamic cloud, this might be required frequently and hence require a high number of processes are needed to service requests In a relatively stable cloud not so much. In either case, 161 was arguably over kill, and we were able to tune this to a more sane value via juju configuration. It was also noted here that the charm’s adaptive configurations could be tweaked to account for these scenarios 6.
### Recurring problems
Tuning the number of metadata services freed up significant resources across the cluster to solve the problem for the customer. However, the problem returned and this time there were no significant resource consumers.
Investigating /proc/zoneinfo yielded some inconsistencies with
min/low/high watermarks. On this kernel the gap between min/low/high is
calculated by the max of either:
- minfreepages * (zone->managedpages/sumofmanagepageallzones)
- zone->managedpages * watermarkscalefactor/10000
On this node (which allocated hugepages at boot and set minfreekbytes=16614), /proc/zoneinfo showed the following:
Node 0, zone   Normal
  pages free     1063536
        min      1510
        low      3079
        high     4648
        managed  48756637
It was evident that if you took the ‘default’ value of watermarkscalefactor and echoed it back into proc/sys/vm the values of these changed.
### Calculating watermark scale factor: a tangled history.
First, HugePages allocated at boot are done by reserving them with the boot memory allocator. At the end of the boot stage, boot memory allocator (memblock) transfers the remaining memory to the Buddy allocator and populates zone -> managedpages. Then the watermark is calculated, at the point in time when HugePages are still allocated and reserved by the boot memory allocator. Because of this the calculation min/low/high watermarks small when compared with the a value calculated later (say at runtime). Then reserved HugePages are returned from memblock reserved list to HugePage free list and added to zone -> managedpages. Because of this the value of min/low/high watermarks at runtime the values will be much larger.
Ideally, at least in this case, the watermark calculation should be based on the memory excluding hugepages which cannot be used by the Buddy allocator. This however may have implications for Transparent Huge Pages and values reported by free which would need to be addressed.
In this case there (despite the mismatch) there was still evidence that compaction thresholds were not being reached before seeing page allocation failures. I implemented the following to address this.
echo 50 | sudo tee /proc/sys/vm/watermark_scale_factor
# lower threshold to compacting memory
echo 200 | sudo tee /proc/sys/vm/extfrag_threshold
While the solutions were simple (upgrade your systems, tune your parameters appropriately), the analysis required to get there was anything but. In each case there were multiple layers to inspect, and many conflicting services to analyse which my talk and this article demonstrate.

